
We built a cloud-native app. Well, no big deal, we do that all the time. This time, however, it was a bit different. This app was directly integrating one of our partners with our internal business systems and the leadership wanted some real time monitoring and business insights into the integration and the data flowing in.
The problem statement Link to heading
We needed to track the flow of data from our partner’s systems to ours on a predefined grain level with possible outcomes/anomalies reported in near real-time.
Here’s how we approached the problem. First of all, we defined the possible — the data flowing in from the partner system can end up — 1. Successfully posted to our system, 2. Rejected by our system because of data issues (bad schema, bad data, etc. etc.) and 3. The underlying request itself failed (400s, 500s, etc. etc.) and data could not be posted.
The data: Business events telemetry Link to heading
Generally, when we think of logging and telemetry, we think about requests, errors, exceptions, failures and verbose. In this scenario, we logged business events too. Business events for each step of the data flow right from the point where the request hits our system to the point when it is marked completed. We divided this entire flow into several business events and logged them with a correlation id so that they can be brought together for analysis later. The typical business events, we noted, were — 1. Message received, 2. Data validated, 3. Data transformed and/or enriched, 4. Posted to our internal system(s), 5. Accepted or Rejected by the system, 6. Requests failed (if any). All these events had custom attributes for correlation id, a unique name so that they can be identified in the sea of telemetry, and a parent process name (in case we wanted to reuse the same events to track a different flow in future).
For example, in our scenario, the Message Received from event had the following custom attributes,
Process Name: PartnerEventIngestion
Name: MessageReceived.<_PartnerId_\>.<_ReceiverSystemId_\>
CorrelationId: <_The primary key/property of the message_\>
The data sink: Azure Application Insights Link to heading
In simple language, Application insights is a cloud based logging platform from Microsoft Azure. But it’s actually a lot more than that and I would recommend going through this link to get a detailed overview. Now, coming to how we used it for our scenario.
We used the Application Insights SDK for .NET applications and installed the NuGet package in our cloud app project. By the way, our cloud app is an Azure Service Fabric based stateless micro-service exposing an API to be consumed by the partner system. From here, life becomes easy. The Application Insights API is pretty easy to use to send custom events. This article on Microsoft docs is what we used as a reference.
Here’s some sample code to send a custom event with the above mentioned attributes,
// This should be initialized only once
var client = new TelemetryClient();

var eventTelemetry = new EventTelemetry(“MessageReceived”);

eventTelemetry.Properties.Add(“Name”, “MessageReceived.<PartnerId>.<ReceiverSystemId>”);

eventTelemetry.Properties.Add(“CorrelationId”, message.Id);

eventTelemetry.Properties.Add(“ProcessName”, “PartnerEventIngestion”);

client.TrackEvent(eventTelemetry);
Note that we’ve used the properties dictionary of the EventTelemetry object to send custom attributes in the AI event.
By this time, our cloud app is sending the business events identified in the process flow using Azure Application Insights, with the required attributes, for each message/request received from the partner system. Now, all we need to do is to find and analyse the data coming in these events.
The query engine: Azure Application Insights Analytics Link to heading
For the last few days, for me, AI analytics portal has been the most beautiful and interesting place on the entire internet. When you have enough data coming in, the analytics portal is an absolutely awesome thing to play around with. Application Insights Analytics provides an easy to use querying framework to analyse the incoming telemetry data from AI events or other telemetry types. The AI analytics query language may take some time to get a hang of it, but once you become familiar, it is a powerful tool and can help you unlock a lot of truth from your telemetry data.
For our scenario, all we needed was to find out what’s happening with each of the messages received from the partner system. Also, we wanted to calculate some high-level numbers to report. For example, the number of messages received in a day (or in any time interval), the number of messages accepted and rejected by our system and why. So, we asked (queried) AI analytics and got the answers. Here’s how,
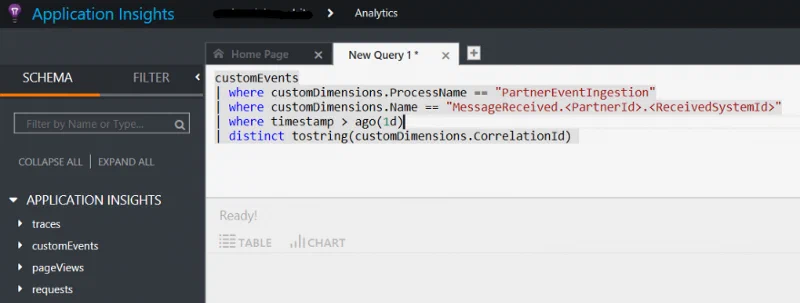
To get the total messages received in the last 24 hours, all we had to do was execute the following query,
customEvents
| where customDimensions.ProcessName == "PartnerEventIngestion"
| where customDimensions.Name == "MessageReceived.<PartnerId>.<ReceivedSystemId>"
| where timestamp > ago(1d)
| distinct tostring(customDimensions.CorrelationId)
Note: The properties sent in the Application Insights EventTelemetry object are queried as CustomDimensions in Application Insights Analytics queries.
The count of rows returned by the above-mentioned query will answer the said question. Similarly, just changing the Name will answer the number of events accepted, rejected or failed in a day. For failed and rejected events, we added another custom attribute for the reason for rejection or error message for failure.
So far so good, now we are able to query the telemetry data our cloud app is sending. What’s next? How do we report this data to the interested audience? Well, let’s draw some charts, shall we?
The report engine: Microsoft Power BI Link to heading
Now that we are able to analyse the telemetry data from our cloud app, we want to share this analysis. This is where Power BI comes in handy. The awesome thing is — Azure Application Insights Analytics and Power BI seamlessly integrate with each other so that real-time telemetry can be reported directly in a dashboard.
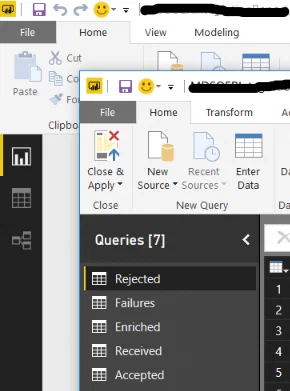
While I’m not going to write about how to use or get started with Power BI in this post, but I will share how we integrated Application Insights and Power BI together. This article here talks, in detail, about how to export Application Insights data to Power BI. We followed the instructions mentioned there and used Power BI desktop to create queries and a consolidated report out of it.
This is how our simple Power BI report looked like with a couple of cards showing received and accepted events.
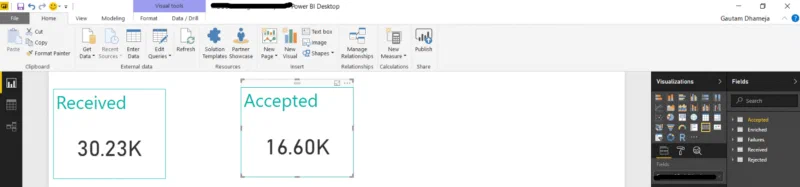
Finally, after adding a few more visualizations for some averages, percentiles for rejected, failed, duration of requests and some other metrics, we clicked on that Publish button and the report was published to our organization’s Power BI work-space.
We created a dashboard in the same Power BI work-space and added live pages from this report to the dashboard. That’s it. We now have a fully featured, real-time monitoring dashboard for our Azure based cloud app which can answer all the questions about the data flowing through it.
Automatic Data Refresh Link to heading
Now, this is important. Once our report was live in Power BI, we wanted it to automatically pull/refresh data at regular intervals. Here’s how we did it — When we publish the report to Power BI, it automatically creates a data set for this report in the same Power BI work-space with the same name. All we need to do is to set a scheduled refresh on that data set in the Power BI portal. This took care of automatic data refresh in the report.
brb, I need to check why so many messages have been rejected. :/